
Debug a failed call with request logs
Every request made with your key is logged — method, path, status, error code and latency — and appears within seconds. It is the fastest way to find out what your integration actually sent, as opposed to what you think it sent.
Open Logs in the Build section. The three cards across the top summarise the last seven days: how many requests, what proportion failed, and average latency.
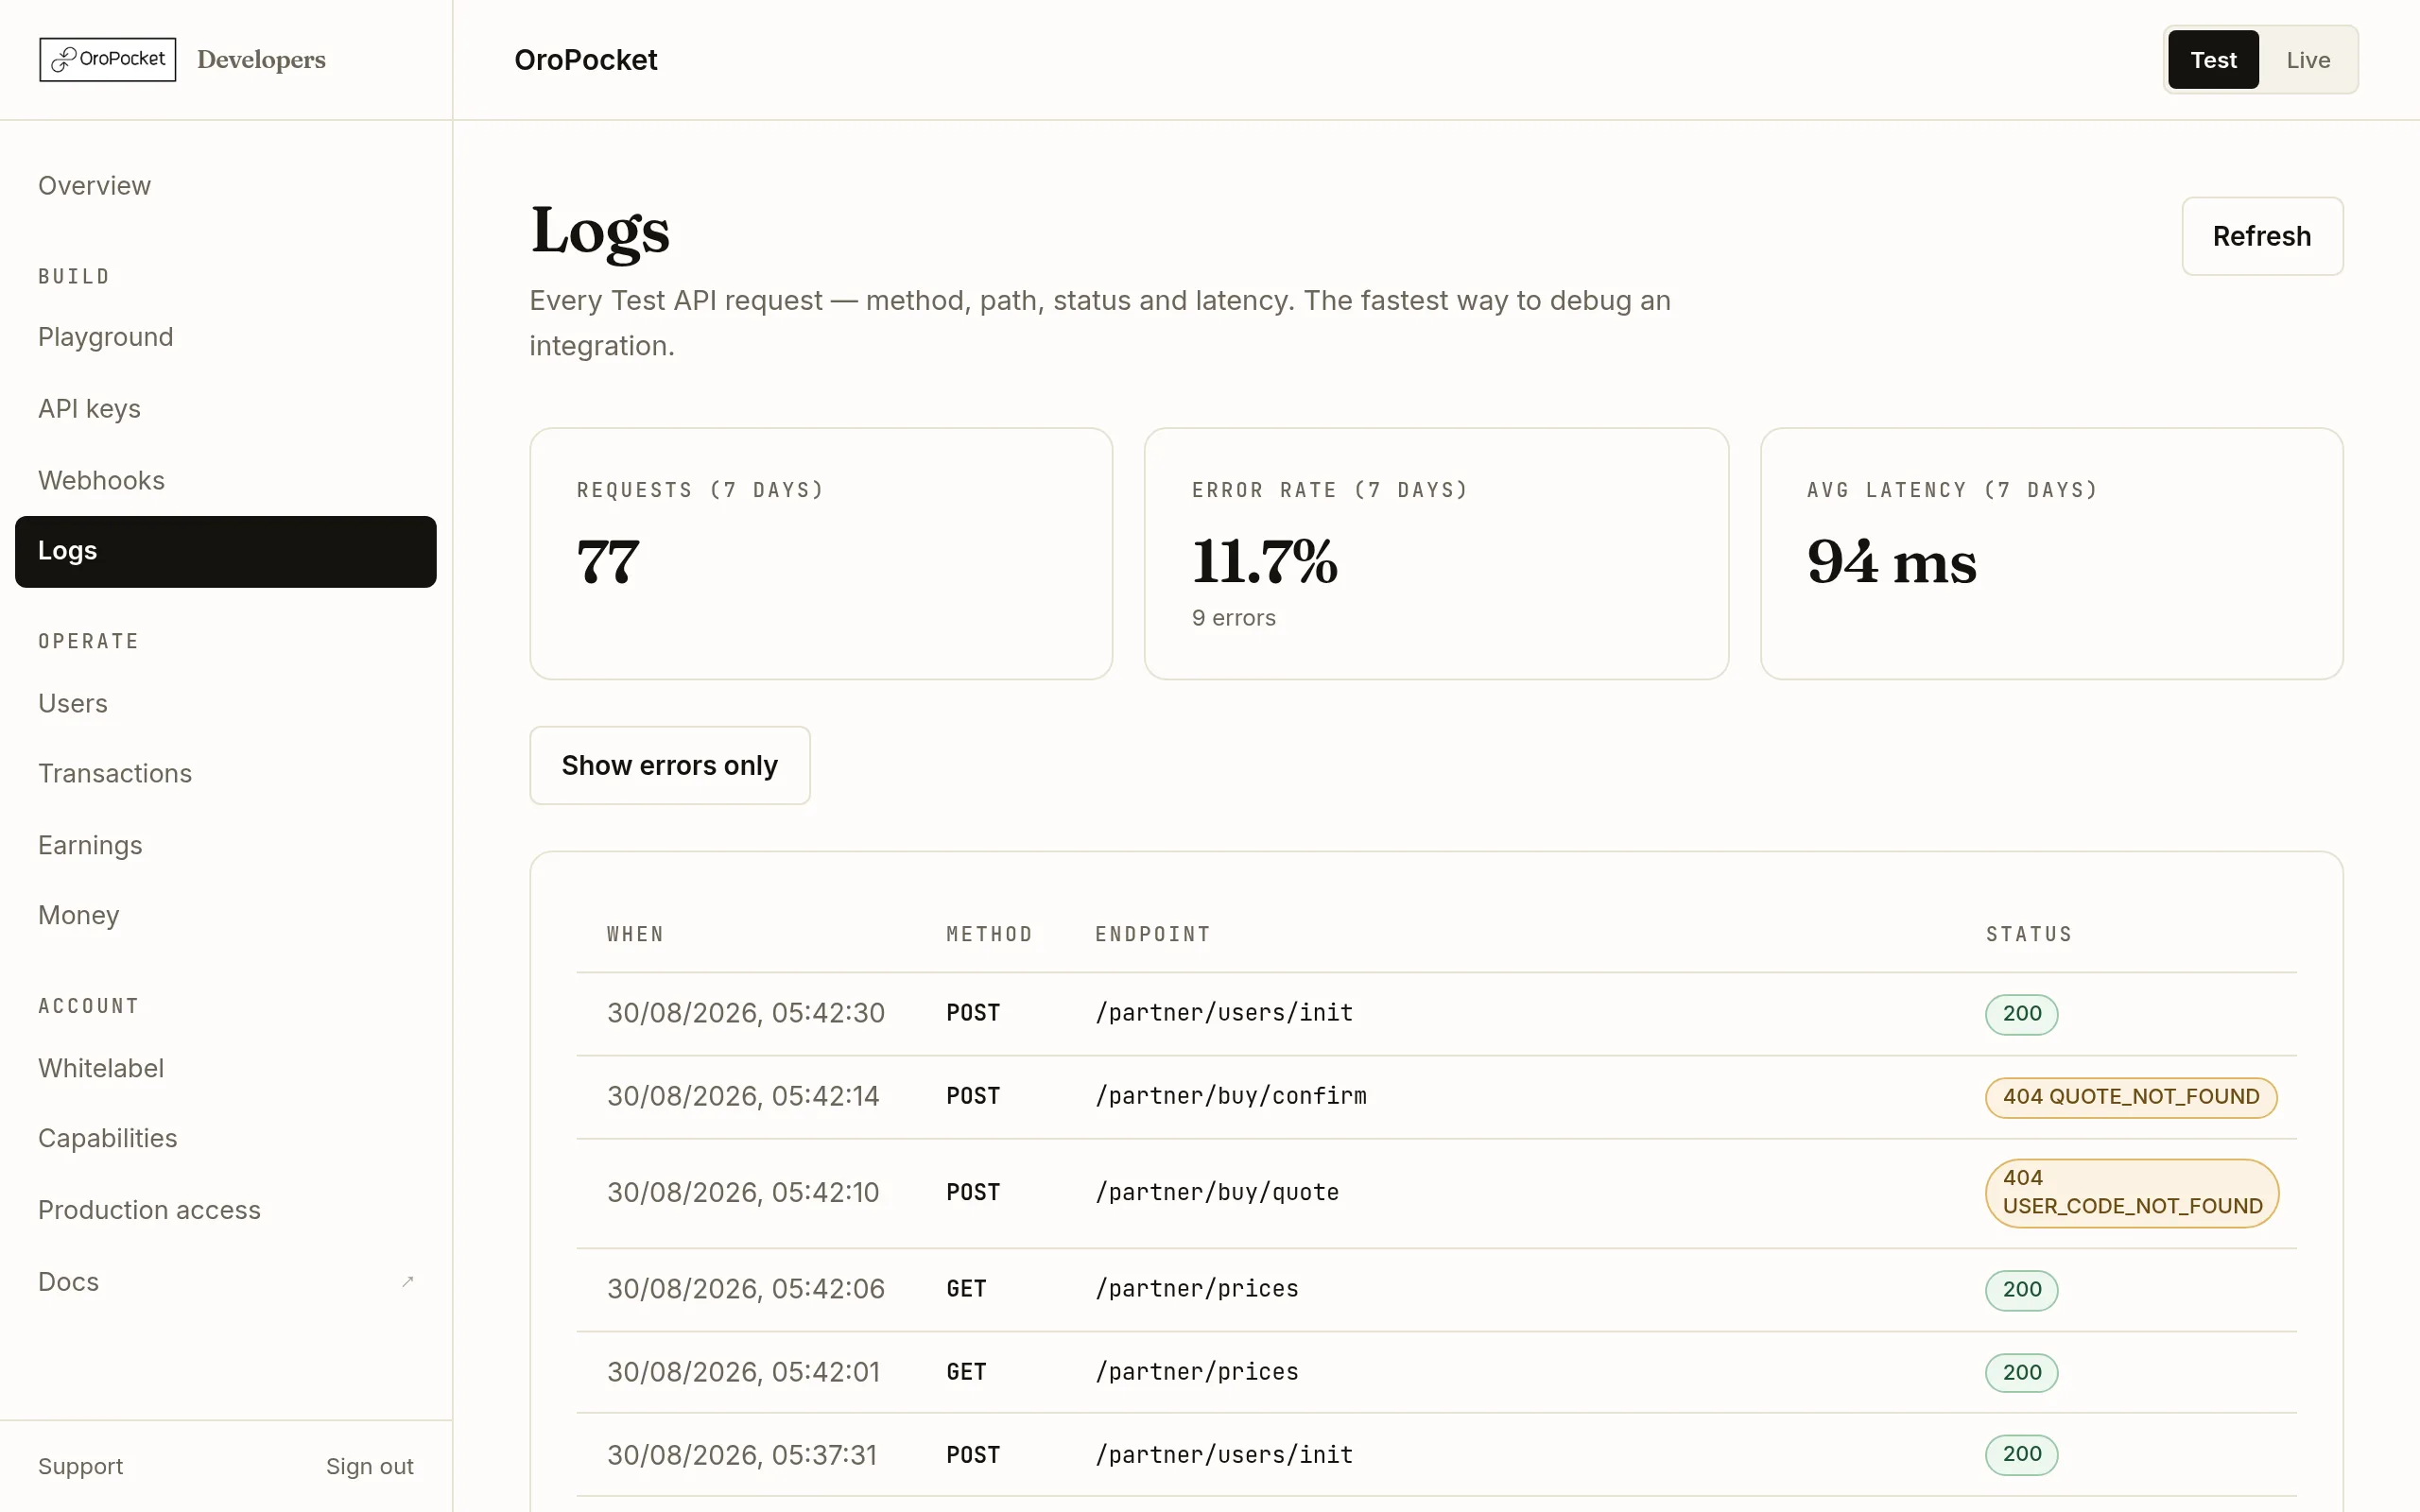
Filter to the failures
Show errors only narrows the table to non-2xx responses and shows a count of how many of the total that is. On a healthy integration this is usually empty, which is itself the answer to “is it us?”
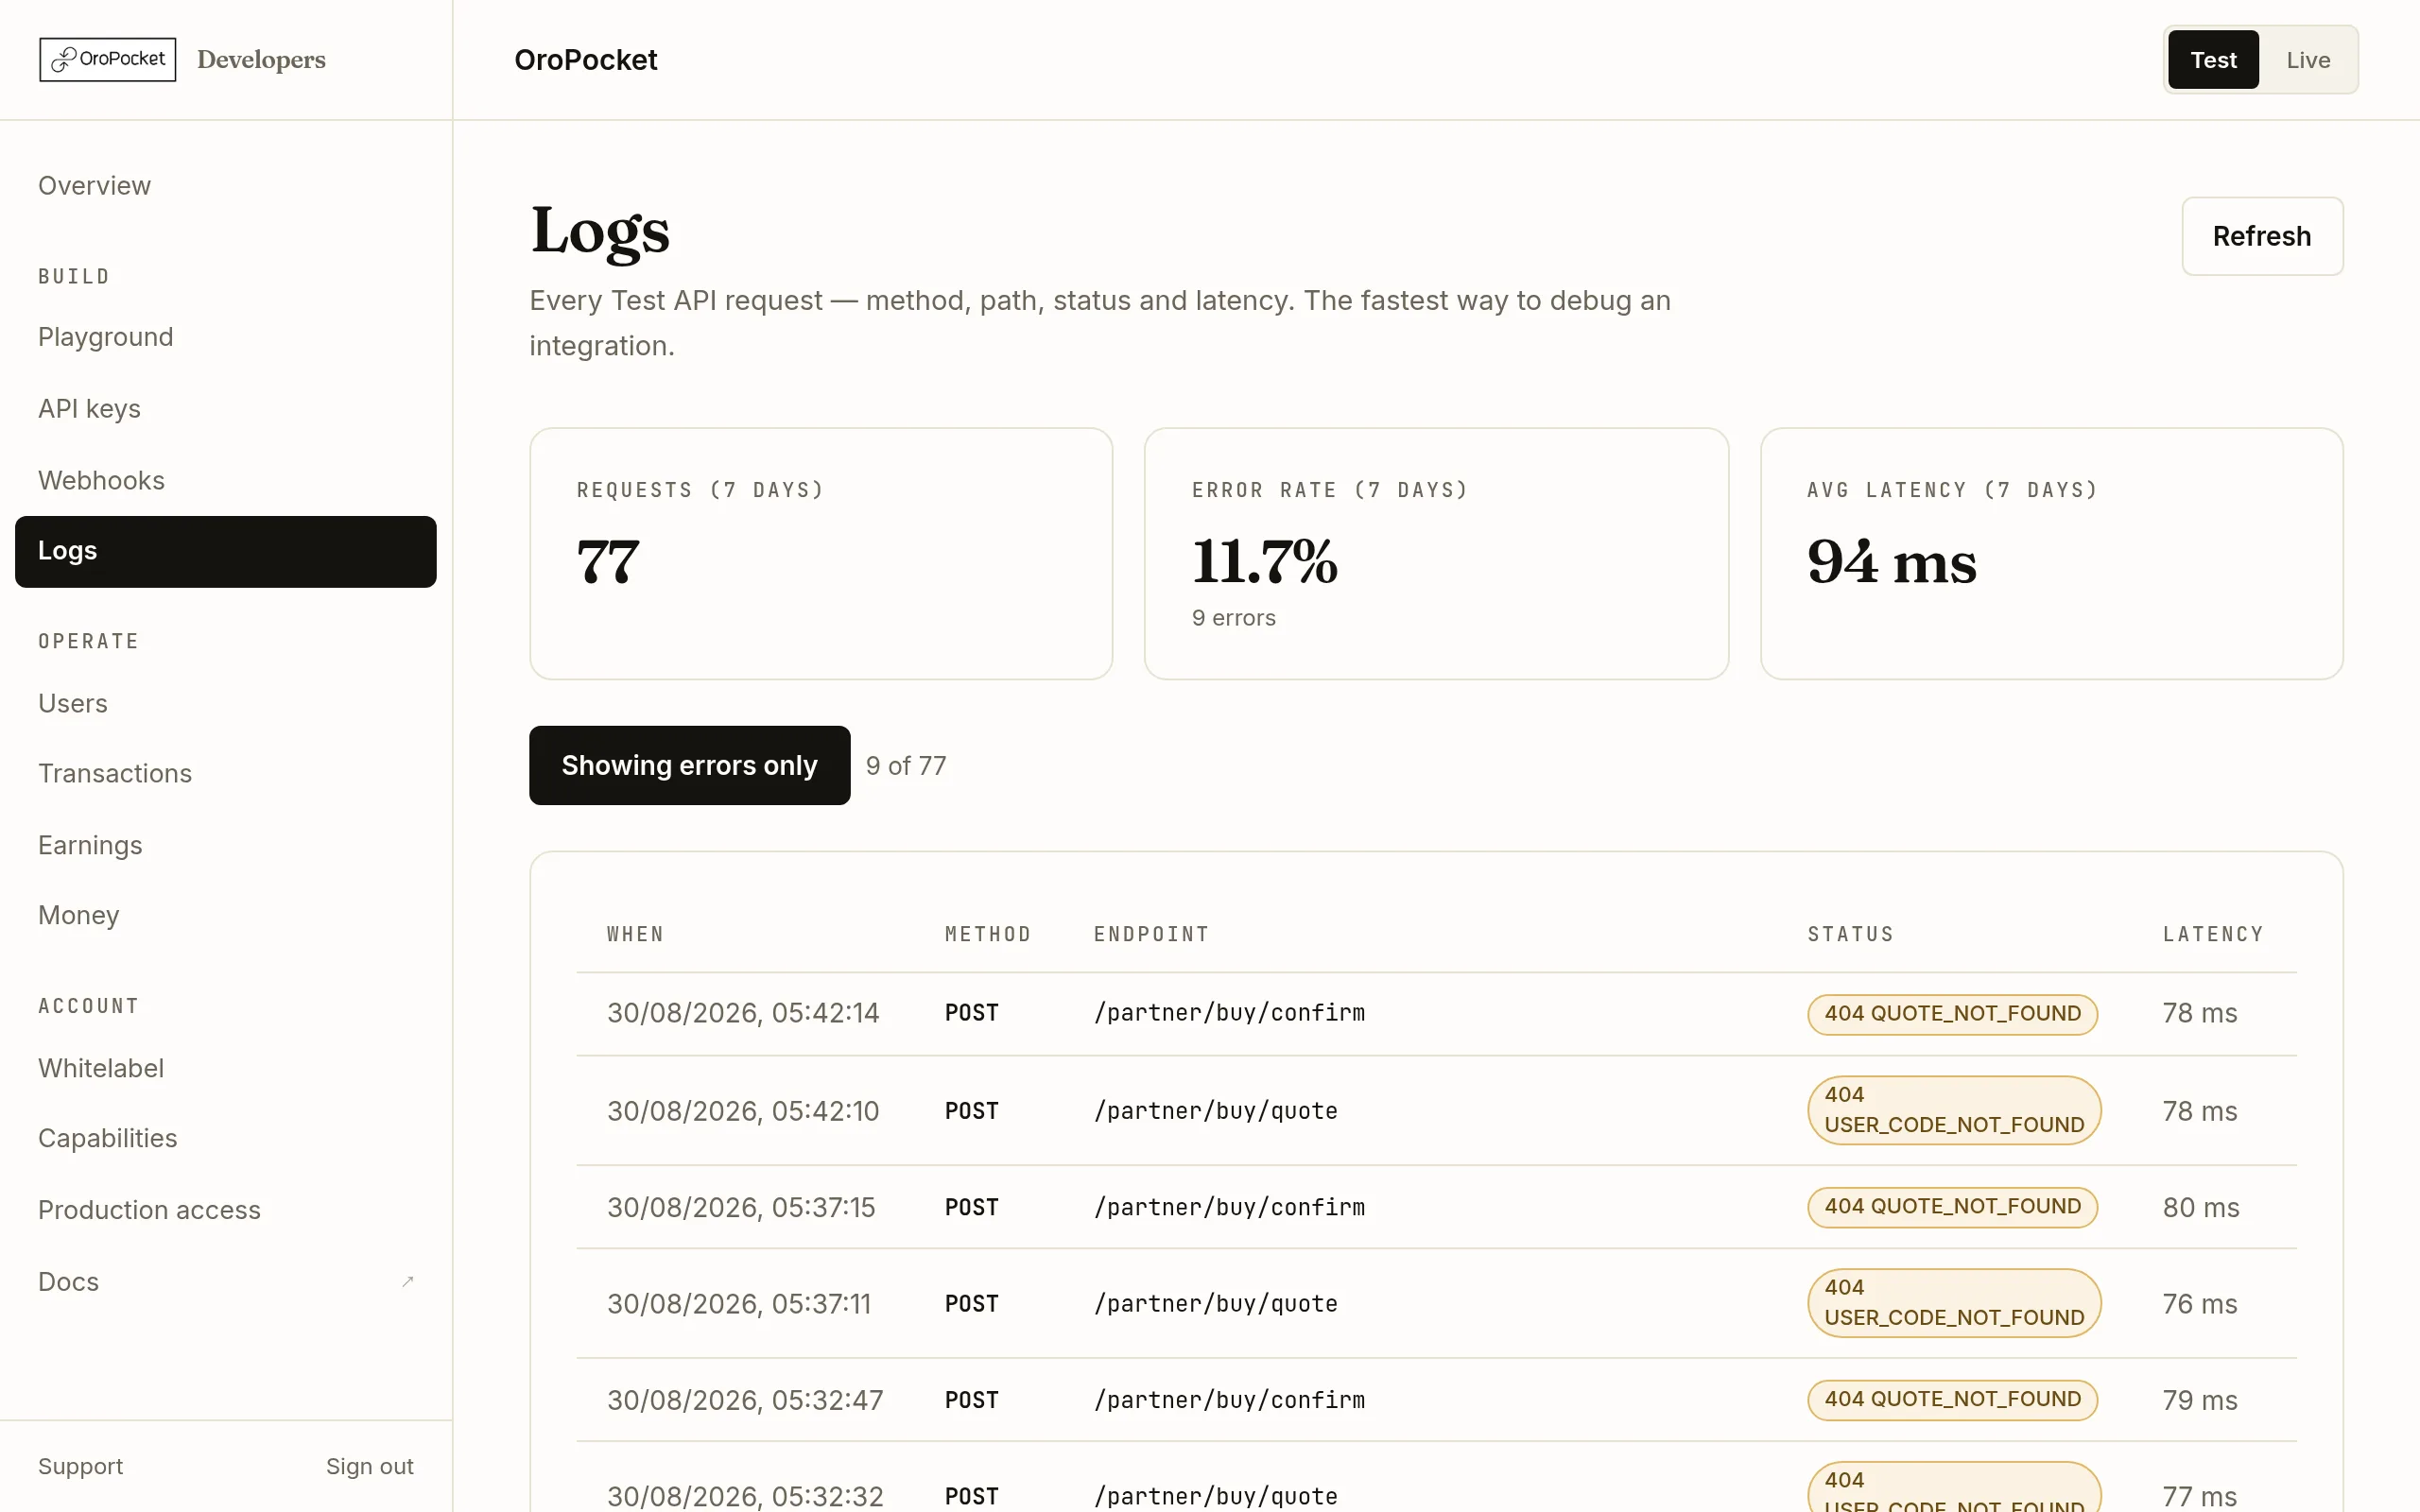
The error code is on the row — you rarely need to open anything to know what went wrong. Read the status badge
The badge carries both halves: the HTTP status and the machine-readable code. Together they are almost always enough to identify the problem without reproducing it.
You see It means 403 API_NOT_ALLOWED The key does not carry the capability that endpoint needs. Fix it on the Capabilities page — no redeploy, no new key. 401 INVALID_TOKEN The key is wrong, revoked, or replaced by a regeneration. Check which one your integration is actually sending. 402 INSUFFICIENT_PARTNER_FUNDS Your billing account cannot cover the buy. See Top up your billing account. 429 RATE_LIMITED Too many requests from one IP. The partner API allows 120 a minute. 429 SANDBOX_DAILY_LIMIT Sandbox is capped at 1,000 requests a day and resets at midnight IST. Live is not capped. Open Details for the request id
Details expands a panel below the table with the endpoint, the status and a copyable Request ID. That id is the same value the API returned in the
X-Request-IDheader and in therequest_idfield of the response body.Quote the request id when you contact support. It resolves to the exact call, so nobody has to ask you to reproduce anything.
The logs follow the Test/Live toggle
You are looking at one mode at a time. A request that seems to be missing is very often a Live request being looked for in Test mode, or the reverse — check the toggle in the header before concluding a call never arrived.
What the latency column is telling you
Latency is measured server-side: our processing time, not the round trip from your infrastructure. If your own timings are much worse than what is shown here, the gap is network or client-side rather than ours. Quotes and confirmations are slower than reads because they take a price lock and write to a ledger.